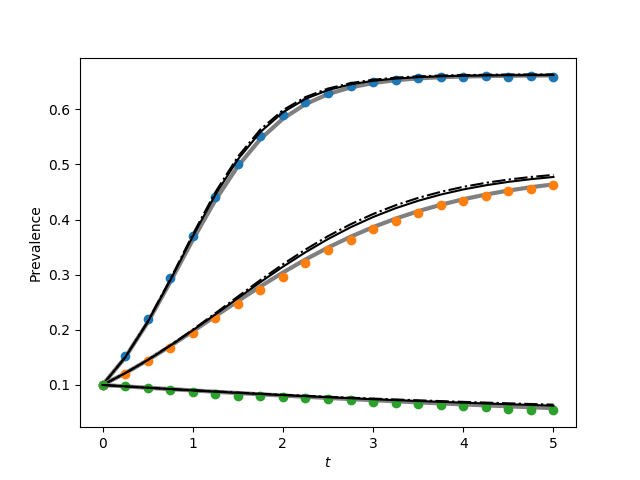
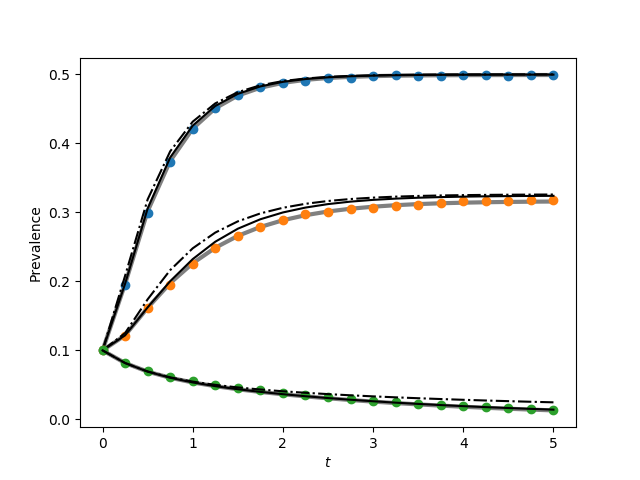
Figure 3.2 (a and b)
In addition to plots in the book’s figure, this also plots the average of 1000 simulations.
For the complete graph, the pair equations run quite slowly (there are N choose 2 edges, and we need equations for each).
This code does not include the triangle corrections mentioned after system (3.26).
import EoN
import networkx as nx
import matplotlib.pyplot as plt
import scipy
import random
from scipy import integrate


'''
Code to generate figure 3.2 from page 94.  This is a bit messy because
we have to define the lumped ODE models.  Since python deals with ODEs by
taking 1D arrays we have to set up all the variables into a single long vector.

This uses the same lumped model as for fig 2.11.

'''
print("There is a difference between the output here and figure3.2a for the\n",
    "book.  This code uses system 3.26, while the figure in the book\n"
    "includes the triangle correction mentioned following system 3.26.\n\n")

print("The code for the complete graph runs quite slowly.  There are very many equations.")


def star(N):
    G = nx.Graph()
    G.add_node(0)
    for node_id in range(1,N):
        G.add_edge(0,node_id)
    return G


def complete_graph_dX(X, t, tau, gamma, N):
    r'''This system is given in Proposition 2.3, taking Q=S, T=I
    f_{SI}(k) = f_{QT}= k*\tau
    f_{IS}(k) = f_{TQ} = \gamma

    \dot{Y}^0 = \gamma Y^1 - 0\\
    \dot{Y}^1 = 2\gamma Y^2  + 0Y^0 - (\gamma + (N-1)\tau)Y^1
    \dot{Y}^2 = 3\gamma Y^3 + (N-1)\tau Y^1 - (2\gamma+2(N-2))Y^2
    ...
    \dot{Y}^N = (N-1)\tau Y^{N-1} - N\gamma Y^N
    Note that X has length N+1
    '''
    #X[k] is probability of k infections.
    dX = []
    dX.append(gamma*X[1])
    for k in range(1,N):
        dX.append((k+1)*gamma*X[k+1]+ (N-k+1)*(k-1)*tau*X[k-1]
                    - ((N-k)*k*tau + k*gamma)*X[k])
    dX.append((N-1)*tau*X[N-1] - N*gamma*X[N])

    return scipy.array(dX)

def complete_graph_lumped(N, tau, gamma, I0, tmin, tmax, tcount):
    times = scipy.linspace(tmin, tmax, tcount)
    X0 = scipy.zeros(N+1)  #length N+1 of just 0 entries
    X0[I0]=1. #start with 100 infected.
    X = integrate.odeint(complete_graph_dX, X0, times, args = (tau, gamma, N))
    #X[t] is array whose kth entry is p(k infected| time=t).
    I = scipy.array([sum(k*Pkt[k] for k in range(len(Pkt))) for Pkt in X])
    S = N-I
    return times, S, I


def star_graph_dX(X, t, tau, gamma, N):
    '''this system is given in Proposition 2.4, taking Q=S, T=I
    so f_{SI}(k) = f_{QT}(k) = k*tau
    f_{IS}(k) = f_{TQ}(k) = gamma
    X has length 2*(N-1)+2 = 2N'''

    #    [[central node infected] + [central node susceptible]]
    #X = [Y_1^1, Y_1^2, ..., Y_1^{N}, Y_2^0, Y_2^1, ..., Y_2^{N-1}]

    #Note that in proposition Y^0 is same as Y_2^0
    #and Y^N is same as Y_1^N

    #Y1[k]: central node infected, & k-1 peripheral nodes infected
    Y1vec = [0]+list(X[0:N])      #for Y_1^k, use Y1vec[k]
    #pad with 0 to make easier calculations Y_1^0=0
    #the probability of -1 nodes infected is 0

    #Y2[k]: central node susceptible & k peripheral nodes infected
    Y2vec = list(X[N:])+[0]   #for Y_2^k use Y2vec[k]
    #padded with 0 to make easier calculations. Y_2^N=0
    #the probability of N (of N-1) peripheral nodes infected is 0
    dY1vec = []
    dY2vec = []
    for k in range(1, N):
        #k-1 peripheral nodes infected, central infected
        dY1vec.append((N-k+1)*tau*Y1vec[k-1] + (k-1)*tau*Y2vec[k-1]
                    +k*gamma*Y1vec[k+1]
                    - ((N-k)*tau + (k-1)*gamma+gamma)*Y1vec[k])
    #now the Y^N equation
    dY1vec.append(tau*Y1vec[N-1] + (N-1)*tau*Y2vec[N-1] - N*gamma*Y1vec[N])

    #now the Y^0 equation
    dY2vec.append(gamma*(N-1)*Y1vec[1] + gamma*Y2vec[1]-0)

    for k in range(1,N):
        #k peripheral nodes infected, central susceptible
        dY2vec.append(0 + gamma*Y1vec[k+1] + gamma*(k+1)*Y2vec[k+1]
                    - (k*tau + 0 + k*gamma)*Y2vec[k])

    return scipy.array(dY1vec + dY2vec)

def star_graph_lumped(N, tau, gamma, I0, tmin, tmax, tcount):
    times = scipy.linspace(tmin, tmax, tcount)
    #    [[central node infected] + [central node susceptible]]
    #X = [Y_1^1, Y_1^2, ..., Y_1^{N}, Y_2^0, Y_2^1, ..., Y_2^{N-1}]
    X0 = scipy.zeros(2*N)  #length 2*N of just 0 entries
    #X0[I0]=I0*1./N #central infected, + I0-1 periph infected prob
    X0[N+I0] = 1#-I0*1./N #central suscept + I0 periph infected
    X = EoN.my_odeint(star_graph_dX, X0, times, args = (tau, gamma, N))
    #X looks like [[central susceptible,k periph] [ central inf, k-1 periph]] x T

    central_susc = X[:,N:]
    central_inf = X[:,:N]
    print(central_susc[-1][:])
    print(central_inf[-1][:])
    I = scipy.array([ sum(k*central_susc[t][k] for k in range(N))
            + sum((k+1)*central_inf[t][k] for k in range(N))
            for t in range(len(X))])
    S = N-I
    return times, S, I


N=100
I0 = 10
gamma = 1
tmin = 0
tmax = 5
tcount = 21
report_times = scipy.linspace(0,tmax, tcount) #for simulations

iterations = 1000


taus1 = [0.03, 0.02, 0.01]
taus2 = [1, 0.5, 0.1]

plt.figure(1)

G = nx.complete_graph(N)

for tau in taus1:

    print(tau)
    print('lumped')
    t, S, I = complete_graph_lumped(N, tau, gamma, I0, tmin, tmax, tcount)
    plt.plot(t, I/N, color = 'grey', linewidth = 3)

    print('I[-1]', I[-1])
    initial_infecteds=random.sample(range(N), I0)

    obs_I = 0*report_times
    for counter in range(iterations):
        if counter%100==0:
            print(counter)
        IC = random.sample(range(N),I0)
        t, S, I = EoN.fast_SIS(G, tau, gamma, initial_infecteds = initial_infecteds, tmax = tmax)
        obs_I += EoN.subsample(report_times, t, I)
    plt.plot(report_times, obs_I*1./(iterations*N), 'o')
    #print(obs_I[-1]/iterations)
    print('individual based')
    t, S, I = EoN.SIS_individual_based_pure_IC(G, tau, gamma, initial_infecteds, tmax=tmax, tcount = tcount)
    plt.plot(t, I/N, '-.', color = 'k')

    print('pair based')
    t, S, I = EoN.SIS_pair_based_pure_IC(G, tau, gamma, initial_infecteds, tmax=tmax, tcount = tcount)
    plt.plot(t, I/N, color = 'k')

plt.xlabel('$t$')
plt.ylabel('Prevalence')
plt.savefig('fig3p2a.png')

plt.clf()
G = star(N)
for tau in taus2:
    print(tau)
    print('lumped')
    t, S, I = star_graph_lumped(N, tau, gamma, I0, tmin, tmax, tcount)
    print(I)
    plt.plot(t, I/N, color = 'grey', linewidth = 3)

    initial_infecteds=random.sample(range(1,N), I0)#not central node 0

    obs_I = 0*report_times
    for counter in range(iterations):
        if counter%100==0:
            print(counter)
        IC = random.sample(range(N),I0)
        t, S, I = EoN.fast_SIS(G, tau, gamma, initial_infecteds = initial_infecteds, tmax = tmax)
        obs_I += EoN.subsample(report_times, t, I)
    #print(obs_I/iterations)
    plt.plot(report_times, obs_I*1./(iterations*N), 'o')

    print('individual based')
    t, S, I = EoN.SIS_individual_based_pure_IC(G, tau, gamma, initial_infecteds, tmax=tmax, tcount = tcount)
    plt.plot(t, I/N, '-.', color = 'k')

    print('pair based')
    t, S, I = EoN.SIS_pair_based_pure_IC(G, tau, gamma, initial_infecteds, tmax=tmax, tcount = tcount)
    plt.plot(t, I/N, color = 'k')
plt.xlabel('$t$')
plt.ylabel('Prevalence')
plt.savefig('fig3p2b.png')