import EoN
import networkx as nx
import matplotlib.pyplot as plt
import scipy
import random
from scipy import integrate
'''
Code to generate figure 2.11. This is a bit messy because we have to
define the ODE models. Since python deals with ODEs by taking 1D arrays
we have to set up all the variables into a single long vector.
'''
def star(N):
G = nx.Graph()
G.add_node(0)
for node_id in range(1,N):
G.add_edge(0,node_id)
return G
def complete_graph_dX(X, t, tau, gamma, N):
r'''This system is given in Proposition 2.3, taking Q=S, T=I
f_{SI}(k) = f_{QT}= k*\tau
f_{IS}(k) = f_{TQ} = \gamma
\dot{Y}^0 = \gamma Y^1 - 0\\
\dot{Y}^1 = 2\gamma Y^2 + 0Y^0 - (\gamma + (N-1)\tau)Y^1
\dot{Y}^2 = 3\gamma Y^3 + (N-1)\tau Y^1 - (2\gamma+2(N-2))Y^2
...
\dot{Y}^N = (N-1)\tau Y^{N-1} - N\gamma Y^N
Note that X has length N+1
'''
#X[k] is probability of k infections.
dX = []
dX.append(gamma*X[1])
for k in range(1,N):
dX.append((k+1)*gamma*X[k+1]+ (N-k+1)*(k-1)*tau*X[k-1]
- ((N-k)*k*tau + k*gamma)*X[k])
dX.append((N-1)*tau*X[N-1] - N*gamma*X[N])
return scipy.array(dX)
def complete_graph_lumped(N, tau, gamma, I0, tmin, tmax, tcount):
times = scipy.linspace(tmin, tmax, tcount)
X0 = scipy.zeros(N+1) #length N+1 of just 0 entries
X0[I0]=1. #start with 100 infected.
X = integrate.odeint(complete_graph_dX, X0, times, args = (tau, gamma, N))
#X[t] is array whose kth entry is p(k infected| time=t).
I = scipy.array([sum(k*Pkt[k] for k in range(len(Pkt))) for Pkt in X])
S = N-I
return times, S, I
def star_graph_dX(X, t, tau, gamma, N):
'''this system is given in Proposition 2.4, taking Q=S, T=I
so f_{SI}(k) = f_{QT}(k) = k*tau
f_{IS}(k) = f_{TQ}(k) = gamma
X has length 2*(N-1)+2 = 2N'''
# [[central node infected] + [central node susceptible]]
#X = [Y_1^1, Y_1^2, ..., Y_1^{N}, Y_2^0, Y_2^1, ..., Y_2^{N-1}]
#Note that in proposition Y^0 is same as Y_2^0
#and Y^N is same as Y_1^N
#Y1[k]: central node infected, & k-1 peripheral nodes infected
Y1vec = [0]+list(X[0:N]) #for Y_1^k, use Y1vec[k]
#pad with 0 to make easier calculations Y_1^0=0
#the probability of -1 nodes infected is 0
#Y2[k]: central node susceptible & k peripheral nodes infected
Y2vec = list(X[N:])+[0] #for Y_2^k use Y2vec[k]
#padded with 0 to make easier calculations. Y_2^N=0
#the probability of N (of N-1) peripheral nodes infected is 0
dY1vec = []
dY2vec = []
for k in range(1, N):
#k-1 peripheral nodes infected, central infected
dY1vec.append((N-k+1)*tau*Y1vec[k-1] + (k-1)*tau*Y2vec[k-1]
+k*gamma*Y1vec[k+1]
- ((N-k)*tau + (k-1)*gamma+gamma)*Y1vec[k])
#now the Y^N equation
dY1vec.append(tau*Y1vec[N-1] + (N-1)*tau*Y2vec[N-1] - N*gamma*Y1vec[N])
#now the Y^0 equation
dY2vec.append(gamma*(N-1)*Y1vec[1] + gamma*Y2vec[1]-0)
for k in range(1,N):
#k peripheral nodes infected, central susceptible
dY2vec.append(0 + gamma*Y1vec[k+1] + gamma*(k+1)*Y2vec[k+1]
- (k*tau + 0 + k*gamma)*Y2vec[k])
return scipy.array(dY1vec + dY2vec)
def star_graph_lumped(N, tau, gamma, I0, tmin, tmax, tcount):
times = scipy.linspace(tmin, tmax, tcount)
# [[central node infected] + [central node susceptible]]
#X = [Y_1^1, Y_1^2, ..., Y_1^{N}, Y_2^0, Y_2^1, ..., Y_2^{N-1}]
X0 = scipy.zeros(2*N) #length 2*N of just 0 entries
X0[I0]=I0*1./N #central infected, + I0-1 periph infected prob
X0[N+I0] = 1-I0*1./N #central suscept + I0 periph infected
X = EoN.my_odeint(star_graph_dX, X0, times, args = (tau, gamma, N))
#X looks like [[central susceptible,k periph] [ central inf, k-1 periph]] x T
central_inf = X[:,:N]
central_susc = X[:,N:]
I = scipy.array([ sum(k*central_susc[t][k] for k in range(N))
+ sum((k+1)*central_inf[t][k] for k in range(N))
for t in range(len(X))])
S = N-I
return times, S, I
N=1000
I0=int(0.1*N)
iterations = 100 #number of simulations to compare
gamma = 1
tmin=0
tmax=5
tcount = 1001
report_times = scipy.linspace(tmin, tmax, 21) #for simulations
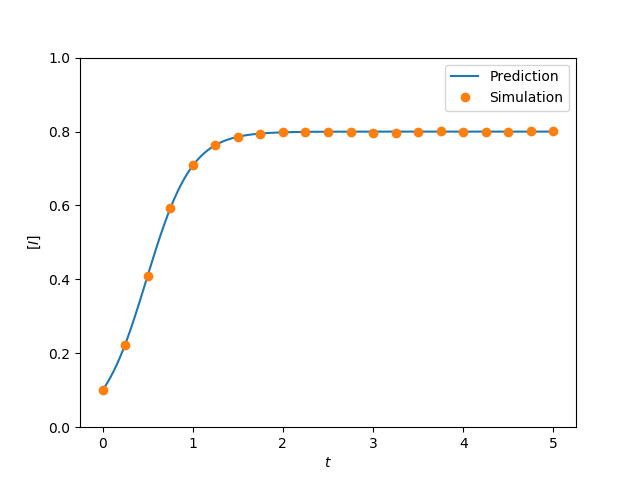
plt.figure(0)
tau = 0.005
G = nx.complete_graph(N)
t, S, I = complete_graph_lumped(N, tau, gamma, I0, tmin, tmax, tcount)
plt.plot(t, I/N, label = 'Prediction')
#now check with simulation
obs_I = 0*report_times
print("done with complete graph ODE. Now simulating")
for counter in range(iterations):
IC = random.sample(range(N),I0)
t, S, I = EoN.fast_SIS(G, tau, gamma, initial_infecteds = IC, tmax = tmax)
obs_I += EoN.subsample(report_times, t, I)
plt.plot(report_times, obs_I*1./(iterations*N), 'o', label='Simulation')
plt.axis(ymin=0, ymax=1)
plt.xlabel('$t$')
plt.ylabel('$[I]$')
plt.legend()
plt.savefig('fig2p11a.png')
print("done with complete graph. Now star --- warning, this may be slow")
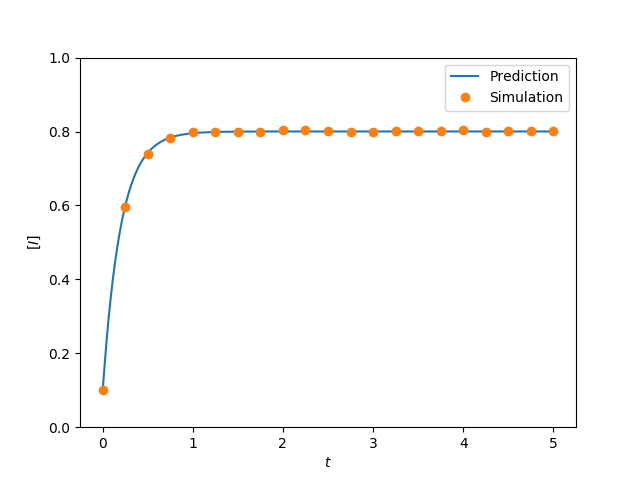
plt.clf()
#for star, if 100 nodes randomly start infected, 1/10 cases have
#central node infected and 99 peripheral. 9/10 have 100 peripheral.
tau = 4.
G = star(N)
t, S, I = star_graph_lumped(N, tau, gamma, I0, tmin, tmax, tcount)
plt.plot(t, I/N, label = 'Prediction')
print("done with star ODE, now simulating")
obs_I = 0*report_times
for counter in range(iterations):
IC = random.sample(range(N),I0)
t, S, I = EoN.fast_SIS(G, tau, gamma, initial_infecteds = IC, tmax = tmax)
obs_I += EoN.subsample(report_times, t, I)
plt.plot(report_times, obs_I*1./(iterations*N), 'o', label='Simulation')
plt.axis(ymin=0, ymax=1)
plt.xlabel('$t$')
plt.ylabel('$[I]$')
plt.legend()
plt.savefig('fig2p11b.png')