import EoN
import networkx as nx
import matplotlib.pyplot as plt
from collections import defaultdict
N=1000
gamma = 1
tau = 1.5/N
G = nx.complete_graph(N)
iterations = 10000
binwidth = 10
H = defaultdict(int)
for counter in range(iterations):
t, S, I, R = EoN.fast_SIR(G, tau, gamma)
H[binwidth*(R[-1]/binwidth)] = H[binwidth*(R[-1]/binwidth)]+1./iterations
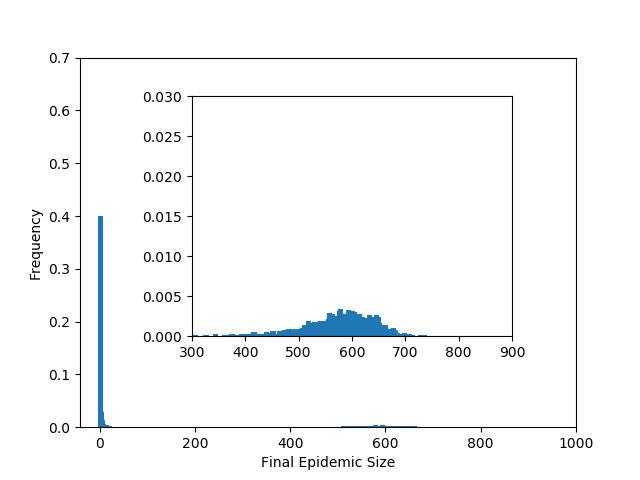
fig = plt.figure(1)
main = plt.axes()
main.bar(*zip(*H.items()), width = binwidth, linewidth=0)
main.axis(xmax=1000, ymax = 0.7)
plt.xlabel('Final Epidemic Size')
plt.ylabel('Frequency')
inset = plt.axes([0.3,0.3,0.5,0.5])
inset.bar(*zip(*H.items()), width = binwidth, linewidth=0)
inset.axis(xmin = 300, xmax = 900, ymin=0, ymax = 0.03)
plt.savefig('fig1p5.png')