import EoN
import networkx as nx
import matplotlib.pyplot as plt
import scipy
import random
N = 1000
kave = 30.
gamma = 1.
tau = 1./15
tmax = 10
rho = 0.05
iterations = 100
tcount = 50
report_times = scipy.linspace(0,tmax,tcount)
SIS_Isum=scipy.zeros(tcount)
SIR_Isum=scipy.zeros(tcount)
for counter in range(iterations):
#do SIS simulation and then SIR simulation.
G = nx.fast_gnp_random_graph(N, kave/(N-1))
initial_infecteds = random.sample(G.nodes(), int(rho*G.order()))
t, S, I = EoN.fast_SIS(G, tau, gamma, initial_infecteds=initial_infecteds, tmax=tmax)
I = EoN.subsample(report_times, t, I)
SIS_Isum += I
plt.figure(0)
plt.plot(report_times, I*1./N, linewidth=1, alpha=0.3, color='grey')
t, S, I, R = EoN.fast_SIR(G, tau, gamma, initial_infecteds=initial_infecteds, tmax=tmax)
I = EoN.subsample(report_times, t, I)
SIR_Isum += I
plt.figure(1)
plt.plot(report_times, I*1./N, linewidth=1, alpha=0.3, color='grey')
S0 = (1-rho)*N
I0 = rho*N
SI0 = (1-rho)*N*kave*rho
SS0 = (1-rho)*N*kave*(1-rho)
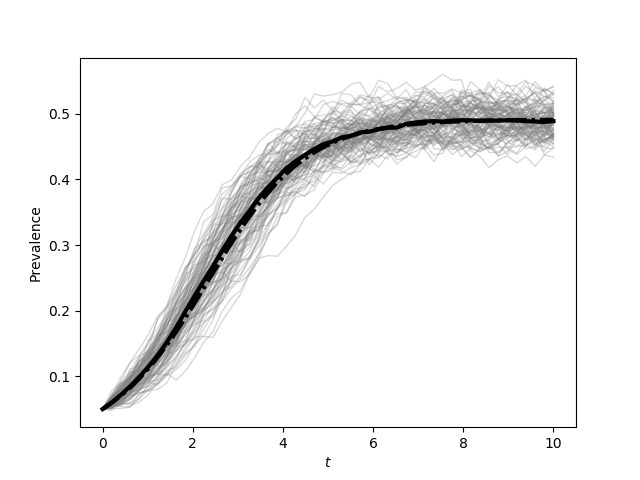
t, S, I = EoN.SIS_homogeneous_pairwise(S0, I0, SI0, SS0, kave, tau,
gamma, tmax=tmax)
plt.figure(0)
plt.plot(report_times,SIS_Isum/(N*iterations), color='k', linewidth=3)
plt.plot(t, I/N, '-.', color='k', linewidth=3)
plt.xlabel('$t$')
plt.ylabel('Prevalence')
plt.savefig('fig4p1a.png')
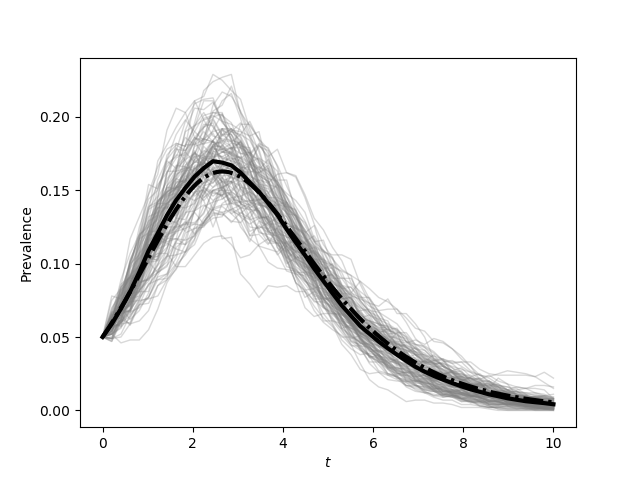
t, S, I, R = EoN.SIR_homogeneous_pairwise(S0, I0, 0, SI0, SS0, kave, tau,
gamma, tmax=tmax)
plt.figure(1)
plt.plot(report_times,SIR_Isum/(N*iterations), color='k', linewidth=3)
plt.plot(t, I/N, '-.', color='k', linewidth=3)
plt.xlabel('$t$')
plt.ylabel('Prevalence')
plt.savefig('fig4p1b.png')