import EoN
import networkx as nx
import matplotlib.pyplot as plt
import scipy
from scipy import integrate
def complete_graph_dX(X, t, tau, gamma, N):
r'''This system is given in Proposition 2.3, taking Q=S, T=I
f_{SI}(k) = f_{QT}= k*\tau
f_{IS}(k) = f_{TQ} = \gamma
\dot{Y}^0 = \gamma Y^1 - 0\\
\dot{Y}^1 = 2\gamma Y^2 + 0Y^0 - (\gamma + (N-1)\tau)Y^1
\dot{Y}^2 = 3\gamma Y^3 + (N-1)\tau Y^1 - (2\gamma+2(N-2))Y^2
...
\dot{Y}^N = (N-1)\tau Y^{N-1} - N\gamma Y^N
Note that X has length N+1
'''
#X[k] is probability of k infections.
dX = []
dX.append(gamma*X[1])
for k in range(1,N):
dX.append((k+1)*gamma*X[k+1]+ (N-k+1)*(k-1)*tau*X[k-1]
- ((N-k)*k*tau + k*gamma)*X[k])
dX.append((N-1)*tau*X[N-1] - N*gamma*X[N])
return scipy.array(dX)
def complete_graph_lumped(N, I0, tmin, tmax, tcount):
times = scipy.linspace(tmin, tmax, tcount)
X0 = scipy.zeros(N+1) #length N+1 of just 0 entries
X0[I0]=1. #start with 100 infected.
X = integrate.odeint(complete_graph_dX, X0, times, args = (tau, gamma, N))
#X[t] is array whose kth entry is p(k infected| time=t).
I = scipy.array([sum(k*Pkt[k] for k in range(len(Pkt))) for Pkt in X])
S = N-I
return times, S, I
N=200
gamma = 1
k = N-1.
tau_c = gamma/k
rho = 0.1
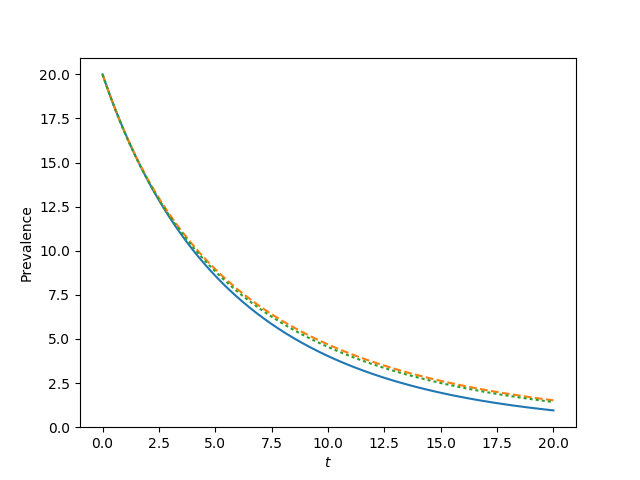
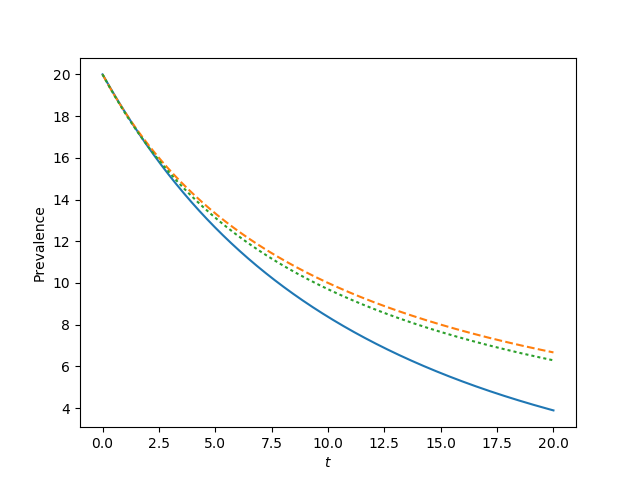
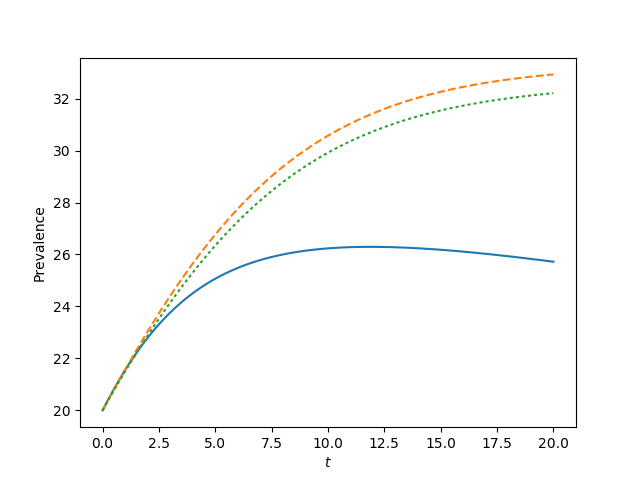
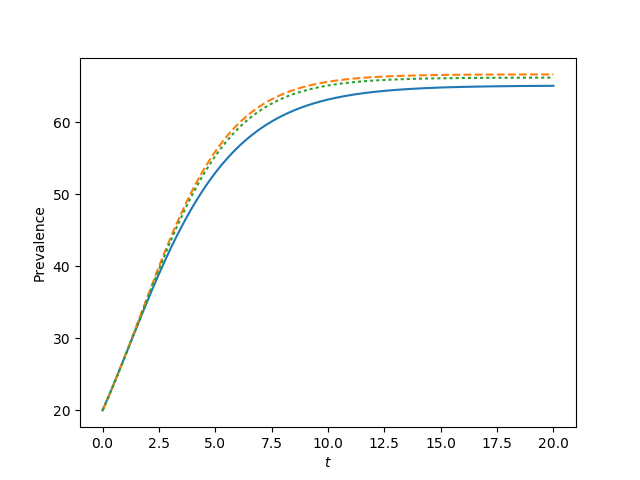
for tau, label in zip([0.9*tau_c, tau_c, 1.2*tau_c, 1.5*tau_c],['a', 'b', 'c', 'd']):
plt.clf()
t, S, I = complete_graph_lumped(N, int(N*rho), 0 , 20, 1001)
plt.plot(t, I)
S0 = (1-rho)*N
I0 = rho*N
t, S, I = EoN.SIS_homogeneous_meanfield(S0, I0, k, tau, gamma, tmin=0, tmax=20,
tcount=1001)
plt.plot(t, I, '--')
S0 = (1-rho)*N
I0 = rho*N
SI0 = (1-rho)*N*k*rho
SS0 = (1-rho)*N*k*(1-rho)
t, S, I = EoN.SIS_homogeneous_pairwise(S0, I0, SI0, SS0, k, tau, gamma, tmin = 0,
tmax=20, tcount=1001)
plt.plot(t, I, ':')
plt.xlabel('$t$')
plt.ylabel('Prevalence')
plt.savefig('fig4p5{}.png'.format(label))