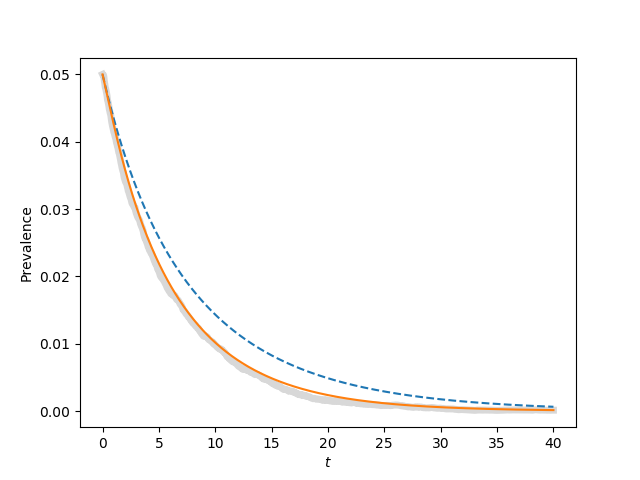
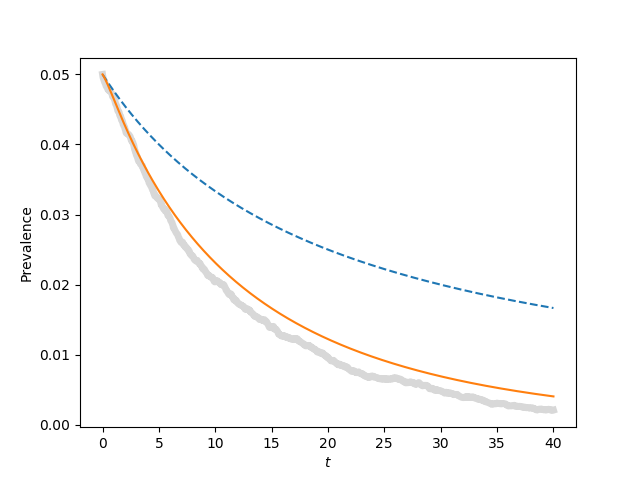
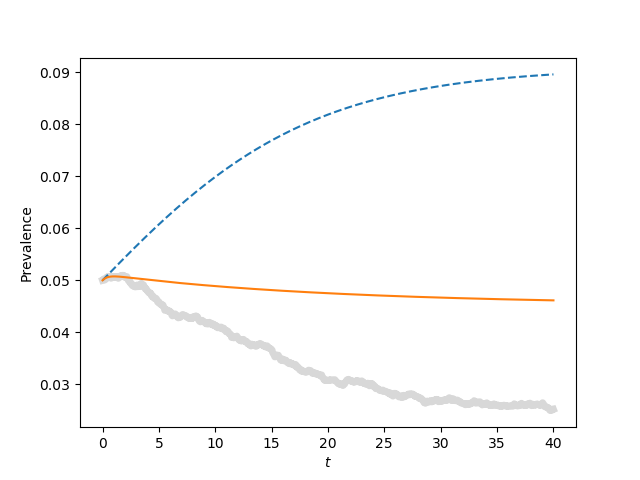
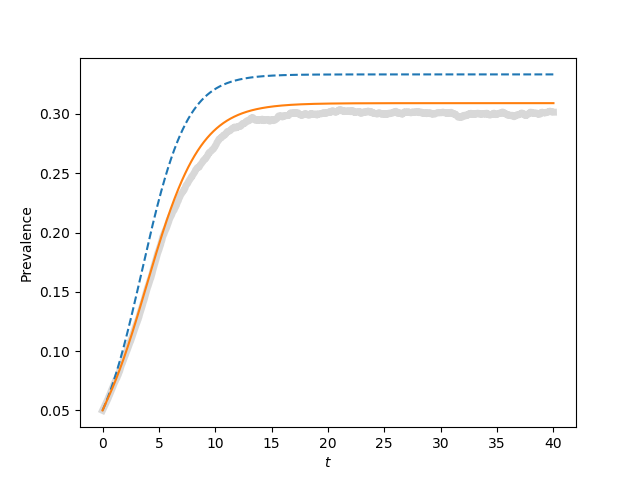
Figure 4.7 (a, b, c, and d)
Note that the book has a typo. For (c), $\tau = 1.1\tau_c$
import EoN
import networkx as nx
import matplotlib.pyplot as plt
import scipy


print(r"warning --- plot c in book is mislabeled.  It should be \tau = 1.1\tau_c, not 1.2\tau_c")
N=1000
kave = 20
gamma = 1.
iterations = 200
tmax = 40
tau_c = gamma/kave
rho = 0.05
tcount=1001

report_times = scipy.linspace(0,tmax,tcount)

for tau, label in zip([0.9*tau_c, tau_c, 1.1*tau_c, 1.5*tau_c],['a', 'b', 'c', 'd']):
    plt.clf()
    Isum = scipy.zeros(len(report_times))
    for counter in range(iterations):
        G = nx.configuration_model([kave]*N)
        t, S, I = EoN.fast_SIS(G, tau, gamma, tmax=tmax, rho=rho)
        I=I*1./N
        I = EoN.subsample(report_times, t, I)
        Isum += I
    plt.plot(report_times, Isum/iterations, color = 'grey', linewidth = 5, alpha=0.3)


    S0 = (1-rho)*N
    I0 = rho*N

    t, S, I = EoN.SIS_homogeneous_meanfield(S0, I0, kave, tau, gamma, tmin=0, tmax=tmax,
                                tcount=tcount)
    plt.plot(t, I/N, '--')
    S0 = (1-rho)*N
    I0 = rho*N
    SI0 = (1-rho)*N*kave*rho
    SS0 = (1-rho)*N*kave*(1-rho)
    t, S, I = EoN.SIS_homogeneous_pairwise(S0, I0, SI0, SS0, kave, tau, gamma, tmin = 0,
                                tmax=tmax, tcount=tcount)
    plt.plot(t, I/N)
    plt.xlabel('$t$')
    plt.ylabel('Prevalence')
    plt.savefig('fig4p7{}.png'.format(label))