import EoN
import networkx as nx
import matplotlib.pyplot as plt
import scipy
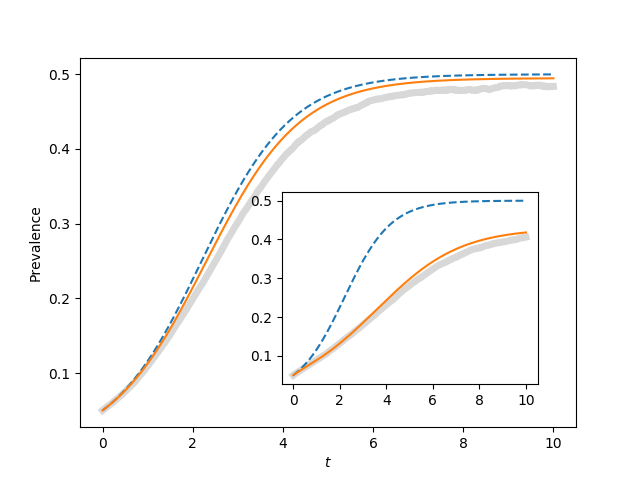
N=1000
gamma = 1.
iterations = 200
rho = 0.05
tmax = 10
tcount = 1001
report_times = scipy.linspace(0,tmax,tcount)
#plt.plot([],[])
ax1 = plt.gca()#axes([0.1,0.1,0.9,0.9])
ax2 = plt.axes([0.44,0.2,0.4,0.4])
for kave, ax in zip([50, 5], [ax1, ax2]):
tau = 2*gamma/kave
Isum = scipy.zeros(tcount)
for counter in range(iterations):
G = nx.configuration_model(N*[kave])
t, S, I = EoN.fast_SIS(G, tau, gamma, tmax=tmax, rho=rho)
I = I*1./N
I = EoN.subsample(report_times, t, I)
Isum += I
ax.plot(report_times, Isum/iterations, color='grey', linewidth=5, alpha=0.3)
S0 = (1-rho)*N
I0 = rho*N
t, S, I = EoN.SIS_homogeneous_meanfield(S0, I0, kave, tau, gamma, tmin=0, tmax=tmax,
tcount=tcount)
ax.plot(t, I/N, '--')
S0 = (1-rho)*N
I0 = rho*N
SI0 = (1-rho)*N*kave*rho
SS0 = (1-rho)*N*kave*(1-rho)
t, S, I = EoN.SIS_homogeneous_pairwise(S0, I0, SI0, SS0, kave, tau, gamma, tmin = 0,
tmax=tmax, tcount=tcount)
ax.plot(t, I/N)
ax1.xlabel('$t$')
ax1.ylabel('Prevalence')
plt.savefig('fig4p8.png')