import networkx as nx
import EoN
import matplotlib.pyplot as plt
r'''This code simulates an SIS epidemic in a graph. The edges are weighted by
two methods: the product of the degrees, or the inverse of that product.
I then run simulations with the transmission rates scaled by the edge weights
such that a random edge would have expected transmission weight 1 (though since
there will be biases in which nodes are most likely to be infected, the
random edge that has an infected node will have higher transmission weight).
'''
N= 100000
rho = 0.001
gamma = 1
G = nx.configuration_model([2,6]*int(N/2)) #N nodes, half have degree 6 and half degree 2
G=nx.Graph(G)
#assign edge weights to be product of degree. Also give another weight to be inverse of product of degrees
weight_sum = 0
inv_weight_sum = 0
for edge in G.edges():
G.edges[edge[0],edge[1]]['weight'] = G.degree(edge[0])*G.degree(edge[1])
G.edges[edge[0],edge[1]]['inv_weight'] = 1./(G.degree(edge[0])*G.degree(edge[1]))
#If networkx is older, use G.edge[edge[0]][edge[1]][...
weight_sum += G.degree(edge[0])*G.degree(edge[1])
inv_weight_sum += 1./(G.degree(edge[0])*G.degree(edge[1]))
#first do it with weight, scaled so that average weight is 1.
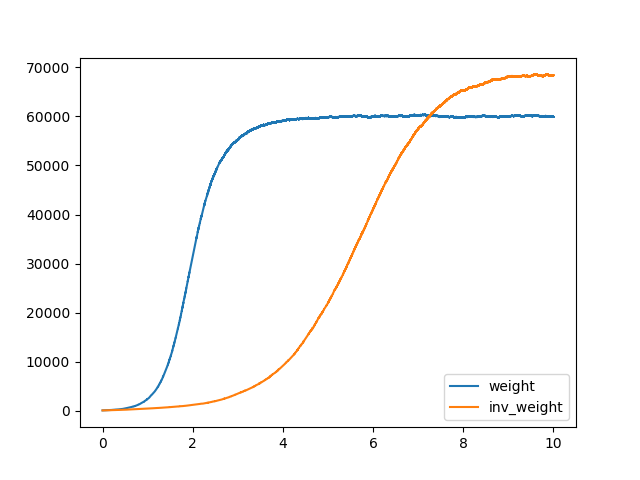
t, S, I = EoN.fast_SIS(G, G.number_of_edges()/weight_sum, gamma, rho = rho, transmission_weight= 'weight', tmax = 10)
plt.plot(t, I, label = 'weight')
t, S, I = EoN.fast_SIS(G, G.number_of_edges()/inv_weight_sum, gamma, rho = rho, transmission_weight= 'inv_weight', tmax = 10)
plt.plot(t, I, label = 'inv_weight')
plt.legend(loc = 'lower right')
plt.savefig('SIS_weighted.png')