import networkx as nx
import EoN
from collections import defaultdict
import matplotlib.pyplot as plt
import scipy
import random
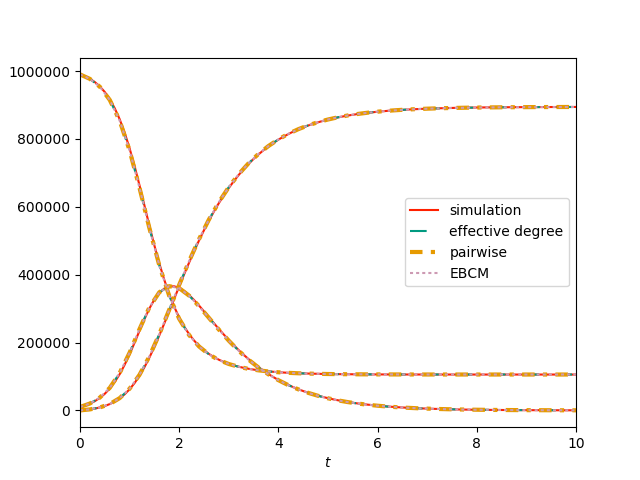
N=10**6
tau = 1.
gamma = 1.
colors = ['#5AB3E6','#FF2000','#009A80','#E69A00', '#CD9AB3', '#0073B3','#F0E442']
kave = 5
G = nx.fast_gnp_random_graph(N, kave/(N-1.))
initial_infecteds = random.sample(range(N),int(0.01*N))
print('simulating')
t, S, I, R = EoN.fast_SIR(G, tau, gamma, initial_infecteds = initial_infecteds)
report_times = scipy.linspace(0,10,101)
S, I, R = EoN.subsample(report_times, t, S, I, R)
plt.plot(report_times, S, color =colors[1], label = 'simulation')
plt.plot(report_times, I, color = colors[1])
plt.plot(report_times, R, color = colors[1])
print('doing ODE models')
t, S, I, R = EoN.SIR_effective_degree_from_graph(G, tau, gamma, initial_infecteds=initial_infecteds, tmax = 10, tcount = 51)
plt.plot(t,S, color = colors[2], dashes = [6,6], label = 'effective degree')
plt.plot(t,I, color = colors[2], dashes = [6,6])
plt.plot(t,R, color = colors[2], dashes = [6,6])
t, S, I, R = EoN.SIR_heterogeneous_pairwise_from_graph(G, tau, gamma, initial_infecteds=initial_infecteds, tmax = 10, tcount = 51)
plt.plot(t, S, color = colors[3], dashes = [3,2,1,2], linewidth=3, label = 'pairwise')
plt.plot(t, I, color = colors[3], dashes = [3,2,1,2], linewidth=3)
plt.plot(t, R, color = colors[3], dashes = [3,2,1,2], linewidth=3) #, dashes = [6,3,2,3]
t, S, I, R = EoN.EBCM_from_graph(G, tau, gamma, initial_infecteds=initial_infecteds, tmax = 10, tcount =51)
plt.plot(t, S, ':', color = colors[4], label = 'EBCM')
plt.plot(t, I, ':', color = colors[4])
plt.plot(t, R, ':', color = colors[4])
plt.axis(xmax=10, xmin=0)
plt.xlabel('$t$')
plt.legend(loc = 'center right')
plt.savefig('fig7p4.png')