import networkx as nx
import EoN
from collections import defaultdict
import matplotlib.pyplot as plt
import scipy
colors = ['#5AB3E6','#FF2000','#009A80','#E69A00', '#CD9AB3', '#0073B3','#F0E442']
iterations = 5*10**3
p=0.25
kave = 5.
Ns = [100, 400, 1600, 6400]#, 25600]
for index, N in enumerate(Ns):
r'''First we do it with the same network for each iteration'''
print(N)
xm = {m:0 for m in range(1,N+1)}
G = nx.fast_gnp_random_graph(N, kave/(N-1.))
for counter in range(iterations):
t, S, I, R = EoN.basic_discrete_SIR_epidemic(G, p)
xm[R[-1]] += 1./iterations
items = sorted(xm.items())
m, freq = zip(*items)
freq = scipy.array(freq)
m= scipy.array(m)
cum_freq = scipy.cumsum(freq)
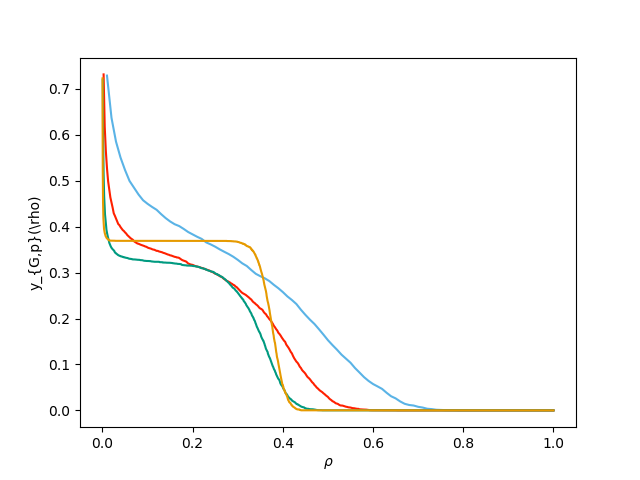
plt.figure(1)
plt.plot(m/N, 1-cum_freq, color = colors[index])
plt.figure(1)
plt.xlabel(r'$\rho$')
plt.ylabel(r'y_{G,p}(\rho)')
plt.savefig('fig6p4a.png')
for index, N in enumerate(Ns):
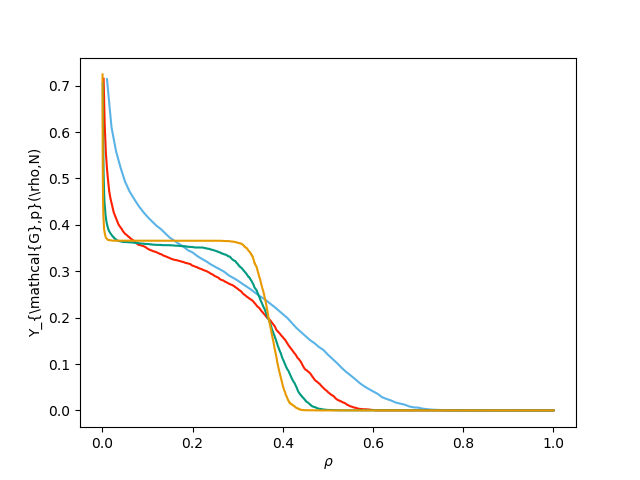
'''Now we generate a new network for each iteration'''
print(N)
xm = {m:0 for m in range(1,N+1)}
for counter in range(iterations):
G = nx.fast_gnp_random_graph(N, kave/(N-1.))
t, S, I, R = EoN.basic_discrete_SIR_epidemic(G, p)
xm[R[-1]] += 1./iterations
items = sorted(xm.items())
m, freq = zip(*items)
freq = scipy.array(freq)
m= scipy.array(m)
cum_freq = scipy.cumsum(freq)
plt.figure(2)
plt.plot(m/N, 1-cum_freq, color = colors[index])
plt.figure(2)
plt.xlabel(r'$\rho$')
plt.ylabel(r'Y_{\mathcal{G},p}(\rho,N)')
plt.savefig('fig6p4b.png')