SIS display example
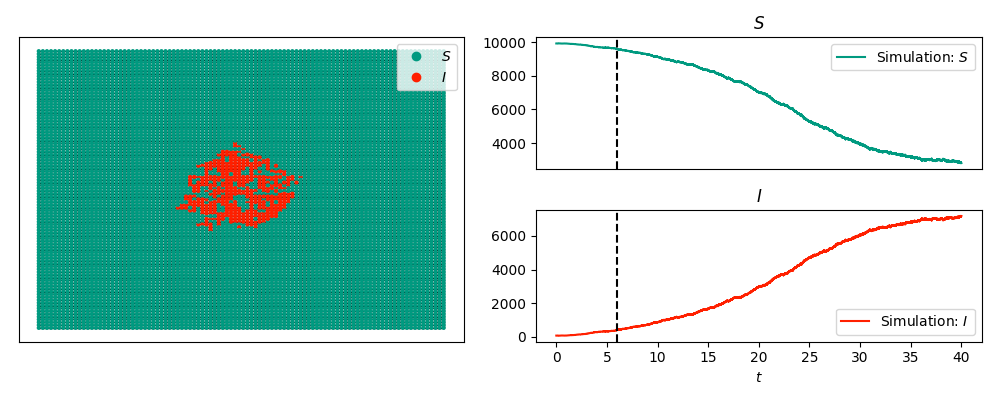
The code below produces a snapshot of an SIS epidemic with the timeseries:
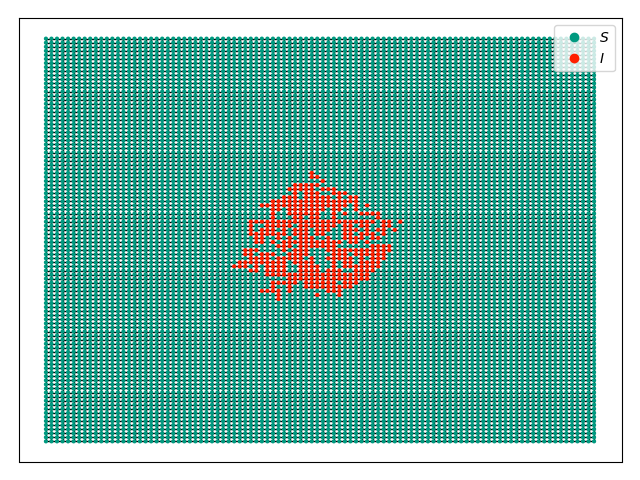
and without the timeseries:
We start with an SIS epidemic in a 100x100 grid with a few nodes infected in the middle. We will display the epidemic at time 6, with and without the time series included.
import networkx as nx
import EoN
import matplotlib.pyplot as plt
G = nx.grid_2d_graph(100,100) #each node is (u,v) where 0<=u,v<=99
#we'll initially infect those near the middle
initial_infections = [(u,v) for (u,v) in G if 45<u<55 and 45<v<55]
sim = EoN.fast_SIS(G, 1.0, 1.0, initial_infecteds = initial_infections,
               return_full_data=True, tmax = 40)
pos = {node:node for node in G}
sim.set_pos(pos)
sim.display(6, node_size = 4) #display time 6
plt.savefig('SIS_2dgrid.png')
If we changed the display command to have ts_plots=False or
ts_plots = [] we get just the network.
plt.clf()
sim.display(6, node_size = 4, ts_plots=[]) #display time 6
plt.savefig('SIS_2dgrid_no_time_series.png')
Animations are shown in the next example.