import EoN
import networkx as nx
from collections import defaultdict
import matplotlib.pyplot as plt
N = 50000
G = nx.fast_gnp_random_graph(N, 5./(N-1))
H = nx.DiGraph() #DiGraph showing possible transitions that don't require an interaction
H.add_edge('I', 'R', rate = 1.4) #I->R
H.add_edge('R', 'S', rate = 0.2) #R->S
J = nx.DiGraph() #DiGraph showing transition that does require an interaction.
J.add_edge(('I', 'S'), ('I', 'I'), rate = 1) #IS->II
IC = defaultdict(lambda: 'S')
for node in range(200):
IC[node] = 'I'
return_statuses = ('S', 'I', 'R')
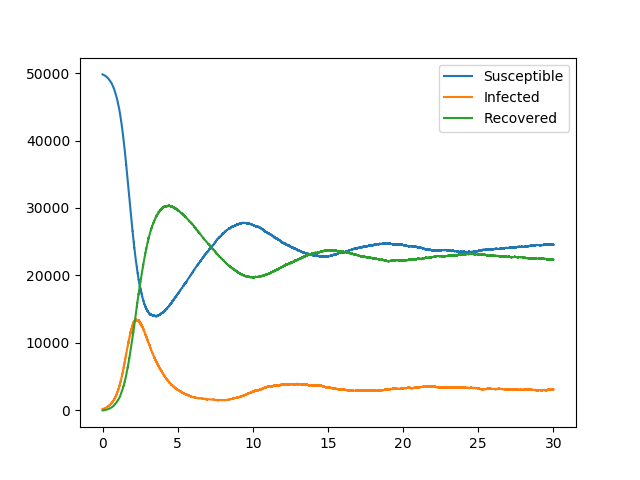
t, S, I, R = EoN.Gillespie_simple_contagion(G, H, J, IC, return_statuses, tmax = 30)
plt.plot(t, S, label = 'Susceptible')
plt.plot(t, I, label = 'Infected')
plt.plot(t, R, label = 'Recovered')
plt.legend()
plt.savefig('SIRS.png')