SEIRT
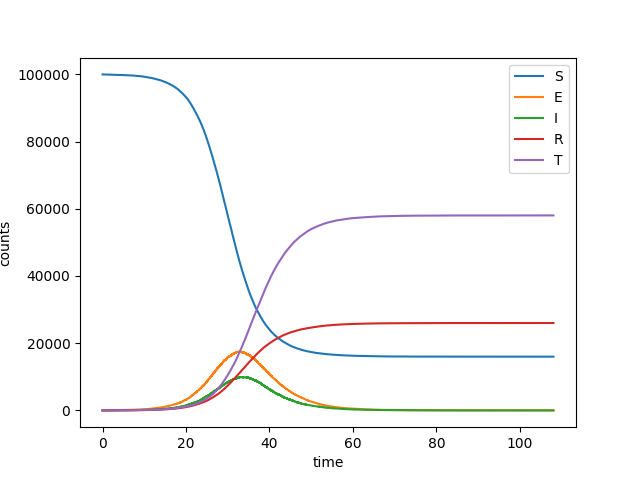
We consider an SEIR style model, but with contact tracing of identified contacts. An infected person may be identified, in which case his/her contacts are traced with some rate.
We consider a simple model, a separate example shows an SEIR model with weighted edges. The method is built on Gillespie_simple_contagion
import EoN
import networkx as nx
from collections import defaultdict
import matplotlib.pyplot as plt
import random

N = 100000
G = nx.fast_gnp_random_graph(N, 5./(N-1))


#we must define two graphs, one of which has the internal transitions
H = nx.DiGraph()
H.add_node('S')  #This line is unnecessary.
H.add_edge('E', 'I', rate = 1./4)
H.add_edge('I', 'R', rate = 1./7)
H.add_edge('I', 'T', rate = 1./10)

#and the other graph has transitions caused by a neighbor.
J = nx.DiGraph()
J.add_edge(('I', 'S'), ('I', 'E'), rate = 2.5/7)
J.add_edge(('T', 'I'), ('T', 'T'), rate = 0.2)
IC = defaultdict(lambda: 'S')
for node in range(20):
    IC[node] = 'I'

return_statuses = ('S', 'E', 'I', 'R', 'T')

t, S, E, I, R, T = EoN.Gillespie_simple_contagion(G, H, J, IC, return_statuses,
                                        tmax = float('Inf'))

plt.plot(t, S, label = 'S')
plt.plot(t, E, label = 'E')
plt.plot(t, I, label = 'I')
plt.plot(t, R, label = 'R')
plt.plot(t, T, label = 'T')
plt.clf()
plt.legend()
plt.xlabel('time')
plt.ylabel('counts')
plt.savefig('SEIRT.png')
plt.show()