Cooperative diseases
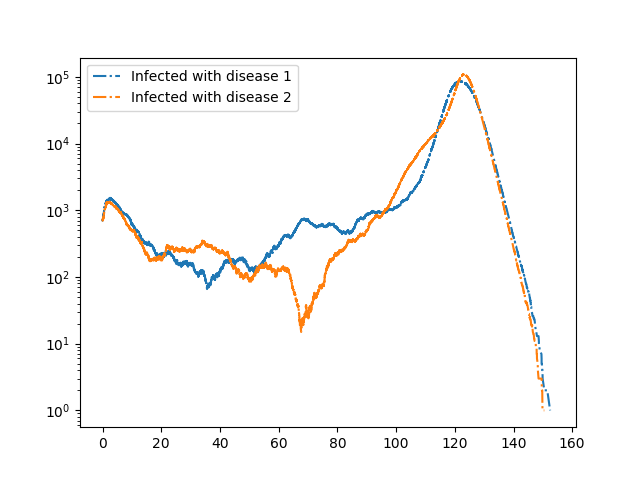
Note that the dynamics of this case are sensitive to noise, so rerunning this code will not yield an exact match to this figure.

We consider two diseases that cooperate in the sense that if an individual has recovered from one disease, then if it is infected with the other disease it transmits with higher rate and it remains infectious longer. This is a bit unrealistic, but could correspond to an individual having a more mild infection resulting in the individual remaining active in the population rather than self-isolating at home.
The method is built on Gillespie_simple_contagion
import EoN
import networkx as nx
from collections import defaultdict
import matplotlib.pyplot as plt

N = 2000000
G = nx.fast_gnp_random_graph(N, 5./(N-1))

#In the below:
#'SS' means a node susceptible to both diseases
#'SI' means susceptible to disease 1 and infected with disease 2
#'RS' means recovered from disease 1 and susceptible to disease 2.
#etc.

H = nx.DiGraph()  #DiGraph showing possible transitions that don't require an interaction
H.add_node('SS')
H.add_edge('SI', 'SR', rate = 1)
H.add_edge('IS', 'RS', rate = 1)
H.add_edge('II', 'IR', rate = 1)
H.add_edge('II', 'RI', rate = 1)
H.add_edge('IR', 'RR', rate = 0.5)
H.add_edge('RI', 'RR', rate = 0.5)

#In the below the edge (('SI', 'SS'), ('SI', 'SI')) means an
#'SI' node connected to an 'SS' node can lead to a transition in which
#the 'SS' node becomes 'SI'.  The rate of this transition is 0.2.
#
#Note that `IR` and `RI` nodes are more infectious than other nodes.
#
J = nx.DiGraph()    #DiGraph showing transitiona that do require an interaction.
J.add_edge(('SI', 'SS'), ('SI', 'SI'), rate = 0.2)
J.add_edge(('SI', 'IS'), ('SI', 'II'), rate = 0.2)
J.add_edge(('SI', 'RS'), ('SI', 'RI'), rate = 0.2)
J.add_edge(('II', 'SS'), ('II', 'SI'), rate = 0.2)
J.add_edge(('II', 'IS'), ('II', 'II'), rate = 0.2)
J.add_edge(('II', 'RS'), ('II', 'RI'), rate = 0.2)
J.add_edge(('RI', 'SS'), ('RI', 'SI'), rate = 1)
J.add_edge(('RI', 'IS'), ('RI', 'II'), rate = 1)
J.add_edge(('RI', 'RS'), ('RI', 'RI'), rate = 1)
J.add_edge(('IS', 'SS'), ('IS', 'IS'), rate = 0.2)
J.add_edge(('IS', 'SI'), ('IS', 'II'), rate = 0.2)
J.add_edge(('IS', 'SR'), ('IS', 'IR'), rate = 0.2)
J.add_edge(('II', 'SS'), ('II', 'IS'), rate = 0.2)
J.add_edge(('II', 'SI'), ('II', 'II'), rate = 0.2)
J.add_edge(('II', 'SR'), ('II', 'IR'), rate = 0.2)
J.add_edge(('IR', 'SS'), ('IR', 'IS'), rate = 1)
J.add_edge(('IR', 'SI'), ('IR', 'II'), rate = 1)
J.add_edge(('IR', 'SR'), ('IR', 'IR'), rate = 1)


return_statuses = ('SS', 'SI', 'SR', 'IS', 'II', 'IR', 'RS', 'RI', 'RR')

initial_size = 700
IC = defaultdict(lambda: 'SS')
for node in range(initial_size):
    IC[node] = 'II'


t, SS, SI, SR, IS, II, IR, RS, RI, RR = EoN.Gillespie_simple_contagion(G, H, J, IC, return_statuses,
                                        tmax = float('Inf'))

plt.semilogy(t, IS+II+IR, '-.', label = 'Infected with disease 1')
plt.semilogy(t, SI+II+RI, '-.', label = 'Infected with disease 2')

plt.legend()
plt.savefig('Cooperate.png')