Competing Diseases


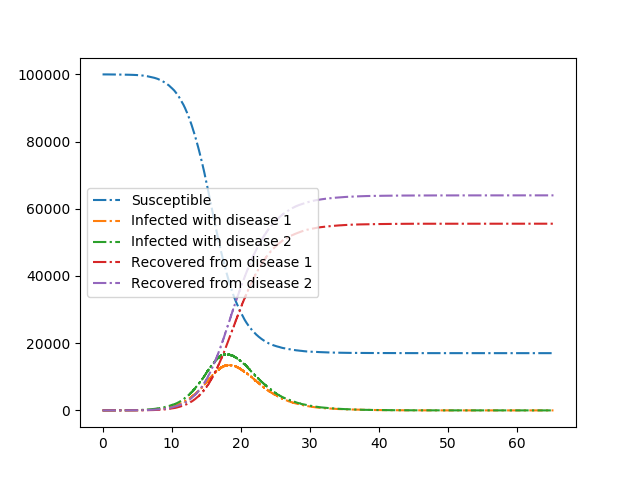
We consider two diseases that compete in the sense that if an individual has recovered from one disease, then if it is infected with the other disease it transmits with lower rate and it recovers faster.
Because our initial condition is quite small, the final outcome is somewhat stochastic, even though the curves look quite smooth. The stochasticity is manifested when the populations are still small.
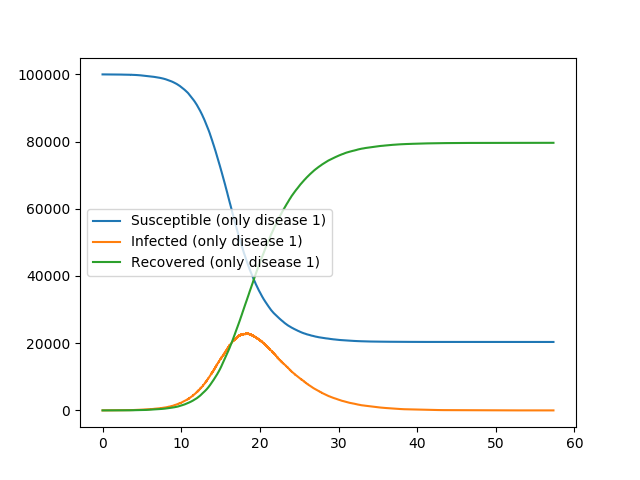
Our first plot shows the two diseases competing. The second plot shows what happens if there is just one disease present.
The method is built on Gillespie_simple_contagion
r'''We consider two diseases that compete in the sense that if an individual has
recovered from one disease, then if it is infected with the other disease it
transmits with lower rate and it recovers faster.'''
import EoN
import networkx as nx
from collections import defaultdict
import matplotlib.pyplot as plt

N = 100000
G = nx.fast_gnp_random_graph(N, 5./(N-1))

H = nx.DiGraph()  #DiGraph showing possible transitions that don't require an interaction
H.add_node('SS')
H.add_edge('SI', 'SR', rate = 0.3)
H.add_edge('IS', 'RS', rate = 0.3)
H.add_edge('II', 'IR', rate = 0.3)
H.add_edge('II', 'RI', rate = 0.3)
H.add_edge('IR', 'RR', rate = 1)
H.add_edge('RI', 'RR', rate = 1)

J = nx.DiGraph()    #DiGraph showing transitions that do require an interaction.
J.add_edge(('SI', 'SS'), ('SI', 'SI'), rate = 0.2)
J.add_edge(('SI', 'IS'), ('SI', 'II'), rate = 0.2)
J.add_edge(('SI', 'RS'), ('SI', 'RI'), rate = 0.2)
J.add_edge(('II', 'SS'), ('II', 'SI'), rate = 0.2)
J.add_edge(('II', 'IS'), ('II', 'II'), rate = 0.2)
J.add_edge(('II', 'RS'), ('II', 'RI'), rate = 0.2)
J.add_edge(('RI', 'SS'), ('RI', 'SI'), rate = 0.1)
J.add_edge(('RI', 'IS'), ('RI', 'II'), rate = 0.1)
J.add_edge(('RI', 'RS'), ('RI', 'RI'), rate = 0.1)
J.add_edge(('IS', 'SS'), ('IS', 'IS'), rate = 0.2)
J.add_edge(('IS', 'SI'), ('IS', 'II'), rate = 0.2)
J.add_edge(('IS', 'SR'), ('IS', 'IR'), rate = 0.2)
J.add_edge(('II', 'SS'), ('II', 'IS'), rate = 0.2)
J.add_edge(('II', 'SI'), ('II', 'II'), rate = 0.2)
J.add_edge(('II', 'SR'), ('II', 'IR'), rate = 0.2)
J.add_edge(('IR', 'SS'), ('IR', 'IS'), rate = 0.1)
J.add_edge(('IR', 'SI'), ('IR', 'II'), rate = 0.1)
J.add_edge(('IR', 'SR'), ('IR', 'IR'), rate = 0.1)

IC = defaultdict(lambda: 'SS')
for node in range(5):
    IC[node] = 'II'

return_statuses = ('SS', 'SI', 'SR', 'IS', 'II', 'IR', 'RS', 'RI', 'RR')

t, SS, SI, SR, IS, II, IR, RS, RI, RR = EoN.Gillespie_simple_contagion(G, H, J, IC, return_statuses,
                                        tmax = float('Inf'))

plt.plot(t, SS, '-.', label = 'Susceptible')
plt.plot(t, IS+II+IR, '-.', label = 'Infected with disease 1')
plt.plot(t, SI+II+RI, '-.', label = 'Infected with disease 2')
plt.plot(t, RS+IR+RR, '-.', label = 'Recovered from disease 1')
plt.plot(t, SR+RI+RR, '-.', label = 'Recovered from disease 2')
plt.legend(loc = 'center left')
plt.savefig('Compete_both.png')

IC = defaultdict(lambda: 'SS')
for node in range(5):
    IC[node] = 'IS'
t, SS, SI, SR, IS, II, IR, RS, RI, RR = EoN.Gillespie_simple_contagion(G, H, J, IC, return_statuses,
                                        tmax = float('Inf'))

plt.clf()
plt.plot(t, SS, '-', label = 'Susceptible (only disease 1)')
plt.plot(t, IS+II+IR, '-', label = 'Infected (only disease 1)')
plt.plot(t, RS+IR+RR, '-', label = 'Recovered (only disease 1)')
plt.legend(loc = 'center left')
plt.savefig('Compete_just1disease.png')