import EoN
import networkx as nx
import matplotlib.pyplot as plt
import scipy
import random
def get_deg_seq(N, Pk):
while True: #run until degree sequence has even sum of N entries
deg_seq = []
for counter in range(N):
r = random.random()
for k in Pk:
if Pk[k]>r:
break
else:
r-= Pk[k]
deg_seq.append(k)
if sum(deg_seq)%2 ==0:
break
return deg_seq
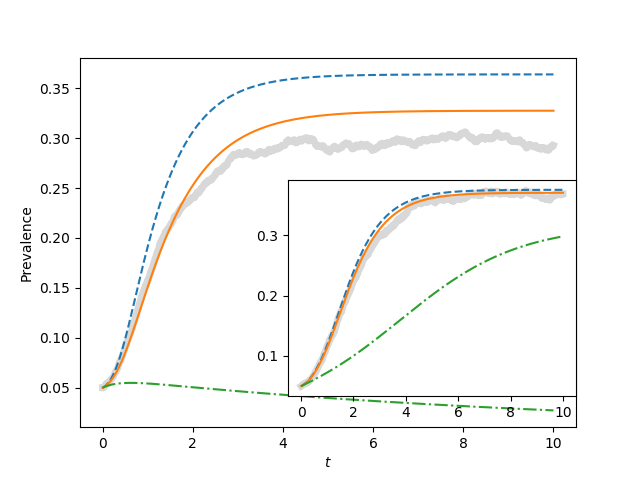
def sim_and_plot(G, tau, gamma, rho, tmax, tcount, ax):
t, S, I = EoN.fast_SIS(G, tau, gamma, rho = rho, tmax = tmax)
report_times = scipy.linspace(0, tmax, tcount)
I = EoN.subsample(report_times, t, I)
ax.plot(report_times, I/N, color='grey', linewidth=5, alpha=0.3)
t, S, I, = EoN.SIS_heterogeneous_meanfield_from_graph(G, tau, gamma, rho=rho,
tmax=tmax, tcount=tcount)
ax.plot(t, I/N, '--')
t, S, I = EoN.SIS_compact_pairwise_from_graph(G, tau, gamma, rho=rho,
tmax=tmax, tcount=tcount)
ax.plot(t, I/N)
t, S, I = EoN.SIS_homogeneous_pairwise_from_graph(G, tau, gamma, rho=rho,
tmax=tmax, tcount=tcount)
ax.plot(t, I/N, '-.')
N=10000
gamma = 1
rho = 0.05
tmax = 10
tcount = 1001
kmin = 1
kmax = 40
Pk = {}
for k in range(kmin, kmax+1):
Pk[k] = k**(-2.)
norm_factor = sum(Pk.values())
for k in Pk:
Pk[k] /= norm_factor
deg_seq = get_deg_seq(N, Pk)
G = nx.configuration_model(deg_seq)
kave = sum(deg_seq)/N
tau = 1.5*gamma/kave
fig = plt.figure(1)
main = plt.axes()
sim_and_plot(G, tau, gamma, rho, tmax, tcount, main)
kmin = 10
kmax = 150
Pk = {}
for k in range(kmin, kmax+1):
Pk[k] = k**(-2.)
norm_factor = sum(Pk.values())
for k in Pk:
Pk[k] /= norm_factor
deg_seq = get_deg_seq(N, Pk)
G = nx.configuration_model(deg_seq)
kave = (sum(deg_seq)/N)
tau = 1.5*gamma/kave
fig = plt.figure(1)
ax1 = plt.gca()
inset = plt.axes([0.45,0.175,0.45,0.45])
sim_and_plot(G, tau, gamma, rho, tmax, tcount, inset)
ax1.set_xlabel('$t$')
ax1.set_ylabel('Prevalence')
plt.savefig('fig5p4.png')